

 Share This Page
| Home | | Sailing | |  |  |  Share This Page Share This Page |
A discussion of modern navigation methods.
— P. Lutus — Message Page —Copyright © 2008, P. Lutus
Introduction | Google Earth | Kayak Island: Shifting Bottom
Strawberry Channel: The Missing Land | Data Conversion Issues | Conclusion
(double-click any word to see its definition)
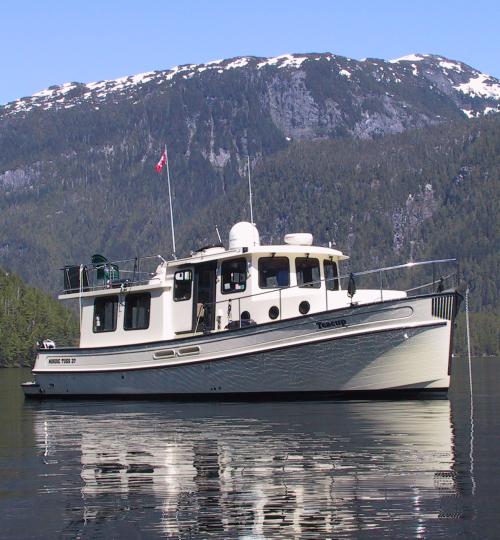 "Teacup", Nordic Tug 37
|
Each year I navigate my Nordic Tug 37 across the Gulf of Alaska, making many side trips along the way, and for guidance I rely primarily on GPS and electronic charts. This article discusses the present state of navigation technology, some issues that have come up, and some ideas for improving navigation.
I've been a sailor for over twenty years and I have seen a number of welcome changes since my around-the-world sail (1988-1991). For that sail I used an older satellite method called "satnav," as well as sextant sights after the satnav receiver gave up the ghost.
In my early sailing days I assumed the charts were accurate, but since I didn't know where I was with any great precision, the accuracy of charts was a secondary issue. This was particularly important while sailing along the Great Barrier Reef in Australia, where one is in constant danger of ripping his boat open against the coral. At that time I thought if I could only know my exact position, I could avoid the risks posed by the coral heads.
GPS and Electronic Navigation
The good news about modern navigation using GPS is that you know where you are with a high degree of certainty, and you can download a full set of free electronic navigation charts. The bad news is that sometimes, critically important information in published charts varies between mediocre and plain wrong.
My education in modern navigation was unexpectedly enhanced one day in 2000 as I sailed in British Columbia. With no warning I grounded firmly on a mud bank at a location where the published chart indicated 30 meters of depth. Because the surface of the mud bank was being mixed and scrambled by the afternoon chop, my depth sounder wasn't able to detect the bottom (an issue to which I shall return), but my keel certainly "detected" it. As I sat well stuck to the bottom, I noticed the GPS was indicating a reliable fix and the electronic chart was showing my position well away from obstacles.
I'm sure many of my readers will have heard the saying, "The map is not the territory." That's understood, but it's equally true that navigational charts are meant to represent reality to the degree that is practical. And everyone should understand there are no guarantees, that a particular chart may not show all navigational hazards, and there won't necessarily be an explicit warning about this limitation printed on the chart.
Also, if all existing navigation charts were supremely accurate and up-to-date, everyone would complain about the cost of the effort. This article describes some ways to accommodate the reality that our charts aren't completely trustworthy, and that this isn't going to suddenly change.
BSB Charts and Laptops
Like many modern sailors, I rely on the BSB charts that are now free from the NOAA website. These BSB charts are scanned from the original paper charts and then calibrated so the electronic presentation preserves the positional accuracy of the originals.
Obviously this reliance on electronic charts adds another failure mode to the life of a sailor — the computer might give up the ghost, after which you don't have any way to navigate. The solution is to carry more than one computer, a solution I carry to an absurd degree now that laptops are so inexpensive. In fact, it has recently occurred to me that the cost of a good laptop, loaded with free charts and a decent navigation program, is cheaper than a set of paper charts in suitable scales for the same territory.
I have recently begun cross-checking navigation charts against satellite images, with surprising results. My current favorite way to locate and manipulate satellite images is called "Google Earth", a free program available for download here for Windows, Mac and Linux. Because it's free, I recommend it to anyone who wants to acquire information about any number of things, but for the purposes of this article, it is an easy way to compare nautical charts to reality.
There are some risks in this activity. One is not knowing for sure when the nautical chart was last updated. Sometimes the most recent update of a nautical chart only involved moving the position of a navaid, rather than resounding the area (a much more expensive activity) and redrawing the depth profiles, in an area where the water depth might change.
Other risks are not knowing when the satellite images were taken, or how quickly the target environment changes. There are many open questions, but in most cases it's reasonable to assume that satellite images are newer than the information used in creating a typical chart.
Given these cautions, it's possible to compare a nautical chart with a satellite image of the same area and discover some interesting things. In Alaska, there are heavily traveled routes where the shore location as well as the water depth changes dramatically from year to year. Such changes are sometimes visible in satellite images years before they might make their way into a nautical chart update.
For this article, I will assume my readers have acquired their free copy of Google Earth, as well as a navigation program or chart viewer and some free BSB charts from the NOAA site.My route through Alaska takes me past Cape Suckling and Kayak Island. Because I travel alone, I try to break this part of the voyage up into manageable pieces, and I anchor at suitable intervals. Years ago I realized the north side of Kayak Island might be a suitable anchorage:
It turns out that the north side of Kayak Island, an obvious shortcut, was part of the Marine Highway System before the 1964 Good Friday earthquake, but the earthquake substantially raised the bottom, and navigation in this area is now risky. For a few years I tried to transit this area on a rising tide by way of several experimental routes, but because I relied on the depths published in navigation charts (primarily chart 16723), my passages ended up being a sequence of groundings and course adjustments.
One issue is that this region's water is so shallow that any route one chooses is going to be difficult (on a good day I might have one or two feet of water beneath my keel). Another issue is that the bottom is composed of soft, shifting mud, which moves about with tidal currents and is also rearranged by the waves that accompany storms. This means bottom measurements, however carefully made, are not valid for very long.
A final issue is that I have never owned a depth sounder that worked in shallow, muddy water. I know it sounds like a joke to say that a depth sounder only works when the water is too deep to pose a risk, but it's often true. One reason for this is that a shallow, muddy bottom gets stirred up by wind and waves as well as a passing boat, so the depth sounder gets thoroughly confused because there really is no bottom to measure. I have a hand sounding line, but that is not easy to use while the boat is moving, and periodically stopping the boat to sound the bottom can make the passage take so long that one loses the advantage of the high tide.
An obvious solution is not to try this risky passage, which is the advice most local sailors give. But the passage is possible and relatively safe if one is patient, vigilant, has a suitable tide, and if one takes advantage of all available information.
Here is a section of Chart 16723, showing the routes I would try to use when relying on the nautical chart's depths and profiles (emphatically do not use the displayed routes):
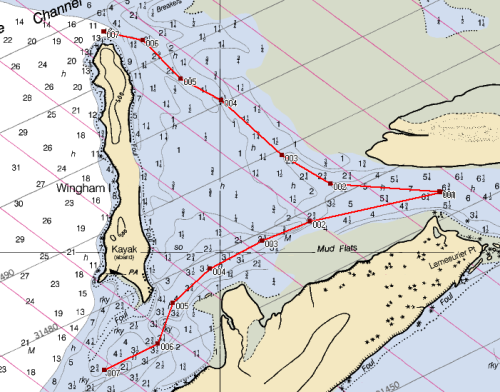 Kayak Island routes, BSB Chart 16723 (not for navigation)
|
By examining this graphic, one can see the routes follow the deepest charted water paths to the north and south of Wingham island. Now here is a satellite image with the same routes superimposed on it:
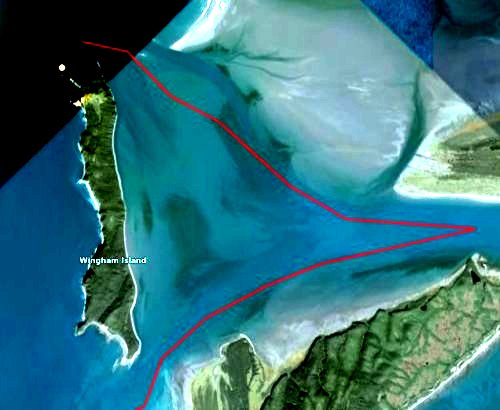 Kayak Island routes, Google Earth (not for navigation)
|
In this Google Earth satellite image (whose contrast has been greatly enhanced), deeper water is indicated by a darker blue color, and shallower areas have a greenish-yellow tint. In both routes, the deepest water no longer lies along the obvious paths based on the original soundings. As it happens, during my most recent passage through the upper of these two routes, I found that, after repeatedly grounding in the mud, I gradually turned north, more or less along the deeper water path shown in the image.
The problems with taking information from satellite images should be obvious — we have a picture that shows deeper water along paths that differ from the nautical chart, but we don't know how deep the water is, and we also don't know when the picture was taken nor whether the deepest path will remain along the same track shown in the picture, days, months or years hence.
I want to emphasize that this example is meant to show that satellite images can provide information not available from other sources, but it is not meant to encourage a passage like the one described.
Unlike the north end of Kayak Island, this next example is a very popular passage through a shallow, changing pass. Many boats use Strawberry Channel/Orca Inlet to make their way between Cordova and the Gulf of Alaska, sometimes daily for fishing. And like Kayak Island, the bottom is constantly changing.
Here is the route I naïvely tried years ago, relying only on the depths and profiles posted on Chart 16709:
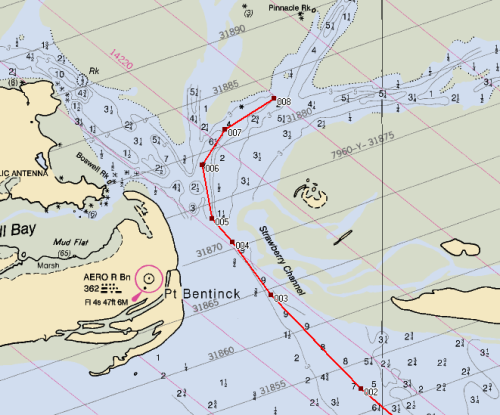 Strawberry Channel, BSB Chart 16709 (not for navigation)
|
Now here's a Google Earth satellite image of the same region with the route superimposed:
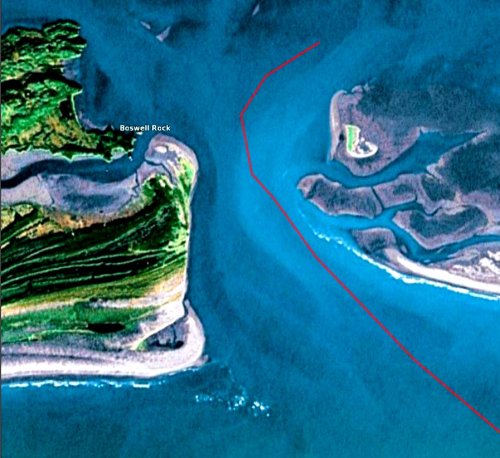 Strawberry Channel, Google Earth (not for navigation)
|
As before, the lighter colors indicate shallower water, and again, the contrast is greatly enhanced. In this case, the published depths, and the location of the channel, have changed entirely (and the chart very clearly says navigation in this area requires local knowledge).
After grounding a few times in this neighborhood in past years, I asked around and the local sailors said, "Stick to the western shore of the channel." This satellite image clearly shows why — the land has been reshaped by tides and weather so the existing navigational chart is ... well ... spectacularly wrong.
But this example is dramatic in another way. While examining the satellite image and redrawing my waypoints for this route, I realized the best path took me through what is presently charted as land! Here is a superimposition of the nautical chart and the satellite image near the western shore of Strawberry Channel:
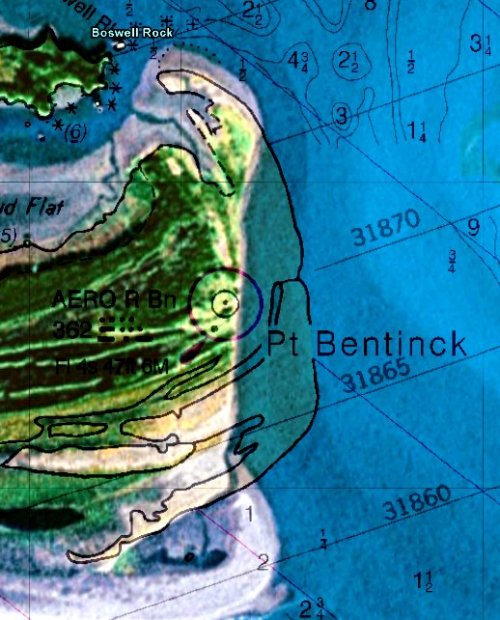 Superimposition of BSB chart 16709
and Google Earth satellite image (not for navigation) |
The difference between the western shore as shown on the newest version of Chart 16709, and the current western shore of Strawberry Channel, is about 750 yards. I was aware the channel had shifted west and I had adjusted my route to some extent, but until I installed Google Earth a few weeks ago and began seriously looking at satellite images, I had no idea how far it had shifted, or the degree to which Chart 16709 differs from reality.
I hope my readers don't draw the wrong conclusion from this. I am not complaining about the accuracy of existing nautical charts, most of which are very accurate. If all the charts were within a gnat's eyelash of reality, I would be complaining about the higher taxes needed to make that happen. I am only saying that sailors have new sources of information that can be used to augment the data in nautical charts.
It would be nice if there was a single universal computer data format for navigational and general position information, but as it happens there are hundreds of mutually incompatible data types for GPS, geocaching, navigation, geographical and general mapping purposes.
I have a few suggestions to make this situation manageable, to allow simple transfer of positions and routes from one place to another:
During my Alaska cruises I have been using a navigation program called "Fugawi", which started out perfectly acceptable and has been gradually getting better. It's the only program I mention on this page that isn't free. Its most recent version (4.5) can read and write the KML data type, and there is an experimental plugin that allows integration with Google Earth, so you can have a side-by-side display of a nautical chart and a satellite image. You can even overlay a nautical chart and a satellite image, which is how I created the overlay picture of Strawberry Channel above. But apart from the experimental direct Google Earth display feature, the current Fugawi version reads and writes KML, which greatly increases the portability of one's nautical routes.
In case my readers think the name "Fugawi" suggests a Japanese-owned company, guess again. It actually alludes to a bad pun about being lost: "where the fugawi?"
I have written some code and Web pages to help in converting and transferring positional data from one environment to another. Called The GPSMap Project, it is an online interface to Google Maps plus some Ruby scripts that can be used to transfer positions between Garmin GPS receivers as well as Google Earth. The scripts are platform-portable (Windows and Linux), free (GPL) and open-source.
I think in the future, sailors will become more reliant on direct satellite imaging for environmental information, and the quality of the satellite data will improve. Our present understanding of land and sea has been greatly improved because of satellite-borne radar, unfortunately radar can't be used in salt water, otherwise it would make possible frequent, inexpensive depth soundings.
However, I think a careful use of satellite-borne multispectral optical techniques may eventually provide depth soundings — or perhaps "depth estimates" might be more accurate — of shallow water areas to augment the costly, laborious traditional method of on-site depth sounding. The results shown on this page are a very primitive and preliminary step in that direction.
| Home | | Sailing | |  |  |  Share This Page Share This Page |